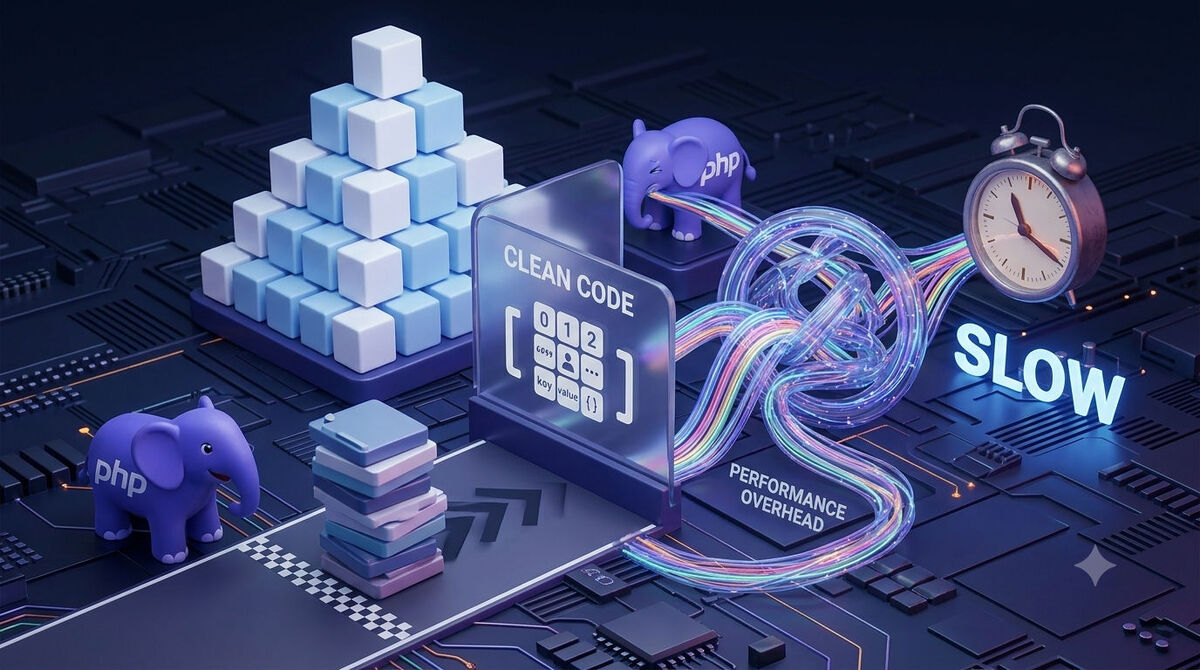
Your Clean Code Might Be Slower Than You Think
Writing clean code is important, but it isn't enough. In this article, we'll explore why issues such as the N+1 Query Problem, lazy loading, missing indexes, and the lack of observability can bring down perfectly organized applications, and why AI coding tools accelerate development but cannot replace a solid understanding of system architecture.
Table of Contents
"It works on my machine."
Few phrases have caused as many problems in software projects as this one.
We often associate code quality with best practices such as small functions, meaningful names, documentation, automated tests, and a well-organized architecture. All of these things matter. However, there is one detail that many developers only discover after deploying an application to production:
clean code is not the same as production-ready code.
An application can be elegant, follow every Clean Code principle, pass every test, and still fail miserably when hundreds of users access it simultaneously.
Most of the time, the problem isn't the syntax or the project structure. It's how the system behaves under load.
That's where hidden pitfalls such as the N+1 Query Problem, lazy loading, missing indexes, saturated connection pools, and the complete lack of observability appear—issues that are almost impossible to notice during local development but can bring down an entire system within minutes.
With the rise of AI coding tools like GitHub Copilot, Cursor, and Claude Code, this has become even more relevant. It has never been easier to generate beautiful, well-structured, and seemingly professional code. At the same time, it has never been easier to produce solutions that hide serious performance bottlenecks until it's too late.
In this article, we'll explore why this happens, analyze a typical production failure, and discuss the four pillars that separate code that merely passes a code review from systems that continue to perform under real-world pressure.
Clean Code Doesn't Mean Fast Code
For many years, the software development community has promoted a set of best practices that genuinely make code easier to understand and maintain. Small functions, descriptive names, low coupling, high cohesion, automated tests, and principles like SOLID are essential for any medium or large project.
The problem begins when we confuse these practices with performance.
Code can be extremely well organized while still executing hundreds of unnecessary database queries, wasting memory, blocking threads, or making an excessive number of calls to external services.
In other words, structural quality and operational quality are two different things.
Imagine two implementations that return exactly the same data:
- one executes a single SQL query;
- the other executes 501 queries.
Both may be equally readable. Both may pass code review. Both may have nearly 100% test coverage.
Yet only one will continue to perform when hundreds of users send the same request simultaneously.
It's important to understand that Clean Code was never intended to solve performance problems. Its purpose is to make software easier to understand and maintain over time.
The issue arises when we assume that elegant code is automatically efficient.
In production, systems are judged by entirely different metrics:
- response time;
- CPU usage;
- memory consumption;
- number of database queries;
- connection pool utilization;
- throughput;
- scalability under load.
None of these metrics can be inferred simply by reading the code.
This is precisely where many developers encounter one of the most infamous backend performance pitfalls.
The Invisible Trap of N+1 Queries
The N+1 Query Problem is one of the most common performance issues in applications that use ORMs such as Eloquent, Doctrine, SQLAlchemy, Entity Framework, Hibernate, Sequelize, Prisma, or Django ORM.
The reason is simple: most of these frameworks use lazy loading by default.
Consider the following Laravel example:
$products = Product::all();

foreach ($products as $product) {
    echo $product->category->name;
}
At first glance, the code looks flawless.
It's concise, expressive, and easy to read.
However, depending on your ORM configuration, it performs:
- one query to retrieve all products;
- one additional query for every accessed category.
With 500 products, you'll end up with approximately:
1 + 500 = 501 queries
The execution flow becomes something like this:
SELECT * FROM products;

SELECT * FROM categories WHERE id = 1;
SELECT * FROM categories WHERE id = 2;
SELECT * FROM categories WHERE id = 3;
...
Fortunately, the fix is remarkably simple:
$products = Product::with('category')->get();
Now Eloquent performs eager loading, reducing hundreds of queries to just two.
The same concept applies to SQLAlchemy:
products = session.query(Product).options(
    selectinload(Product.category)
).all()
Or Django ORM:
products = Product.objects.select_related("category")
Or Prisma:
const products = await prisma.product.findMany({
  include: {
    category: true
  }
});
Notice that the problem was never the programming language.
The problem is the application's behavior.
In a development environment with only a handful of records, you'll probably never notice the difference.
In production, with millions of records and hundreds of concurrent users, the story changes dramatically.
Every extra query consumes:
- a database connection;
- processing time;
- network bandwidth between the application and the database;
- server resources.
The effect is cumulative.
One slow query affects one user.
Hundreds of unnecessary queries affect everyone.
The Database Is Part of Your Code
There's a well-known saying among database administrators:
The database is the application.
While that's an exaggeration, it conveys an important idea: there is no such thing as a fast application running slow queries.
Many developers treat SQL as an implementation detail.
In reality, it's one of the primary factors that determine a system's scalability.
Consider the following query:
SELECT *
FROM orders
WHERE customer_id = 123;
Without an index on customer_id, the database may have to scan millions of rows before finding the desired records.
With the proper index, the difference can be measured in milliseconds instead of seconds.
The same applies to:
- missing indexes;
- poorly designed
JOINs; - queries that return unnecessary columns;
- filtering performed in the application instead of the database;
- inefficient pagination;
- sorting without supporting indexes;
- excessive use of
SELECT *.
Another frequently overlooked aspect is the number of round trips between the application and the database.
Every query involves network communication, server-side processing, data serialization, and sending the response back to the application.
Even extremely fast queries have a cost.
Executing a 2 ms query five hundred times is usually far worse than executing a single 30 ms query.
That's why performance isn't just about application code.
You also need to understand:
- how your data is modeled;
- which indexes exist;
- which queries are being executed;
- how the database chooses execution plans;
- how many concurrent connections your database can handle.
Ignoring this layer is like trying to optimize a car by analyzing only the steering wheel.
Observability: You Can't Optimize What You Don't Measure
There's a curious pattern in slow systems.
Almost nobody discovers the problem by simply reading the code.
The issue becomes apparent only when someone observes the application's behavior.
That capability is what we call observability.
Observability is about collecting enough information to understand a system's internal state through its external signals.
In practice, this means monitoring metrics such as:
- response time;
- SQL query count;
- memory consumption;
- CPU usage;
- errors;
- exceptions;
- time spent calling external services;
- database latency.
Tools such as Laravel Telescope, Laravel Debugbar, Django Debug Toolbar, OpenTelemetry, Prometheus, and Grafana are designed to help with exactly this.
Imagine a request producing the following log:
GET /products

Response Time: 842 ms

SQL Queries: 487
That single log entry is often enough to reveal the root cause.
Without observability, the story is usually very different.
Users start complaining.
The server becomes slow.
The database reaches 100% CPU utilization.
And the team spends hours trying to figure out what happened.
Not because the problem is particularly complex.
But because nobody was measuring what actually mattered.
Before optimizing any system, the first question should always be:
What exactly is slow?
Without that answer, every optimization attempt is just an educated guess.
Context Is the Part Almost Nobody Teaches
Tutorials teach APIs.
Courses teach frameworks.
Documentation teaches features.
Production teaches context.
This is perhaps the biggest leap in a developer's career.
When learning a new technology, we usually work with:
- a handful of records;
- a single user;
- a local database;
- no concurrency;
- a fully controlled environment.
That's a great environment for learning.
But it doesn't represent reality.
In production, you'll encounter factors that rarely appear during tutorials.
For example:
- thousands of concurrent users;
- background processing queues;
- limited connection pools;
- traffic spikes;
- unstable networks;
- unavailable external services;
- tables containing millions of records.
That's when you realize an application must be designed for its worst expected scenario, not its average one.
The same reasoning also explains the limitations of AI coding tools.
GitHub Copilot, Cursor, Claude Code, and similar tools can generate clean, well-structured code in seconds.
But they don't know:
- how much data your application stores;
- your database indexing strategy;
- how many concurrent users your system serves;
- when traffic peaks occur;
- the limitations of your infrastructure.
They write code.
Understanding the system is still the developer's responsibility.
AI accelerates implementation.
It does not replace engineering.
Conclusion
Writing clean code remains an essential skill. Well-structured code is easier to maintain, less error-prone, and significantly improves team collaboration.
But production demands much more.
It requires understanding how software behaves under load, how the database responds to queries, which resources are consumed, how to identify bottlenecks quickly, and how to design systems that can grow.
The N+1 Query Problem is just one example. There are many others: missing indexes, inefficient queries, lack of caching, connection pool contention, unnecessary external service calls, and countless issues that rarely appear in tutorial projects.
What distinguishes experienced developers isn't just their ability to write elegant code.
It's their ability to understand the system as a whole.
Before deploying an application to production, ask yourself:
- How many queries does this request execute?
- Are all of them really necessary?
- Do the database indexes support the filters being used?
- Does the response time remain acceptable under load?
- Do I have enough metrics and logs to identify problems quickly?
Answering these questions can prevent hours of investigation, system downtime, and significant business losses.
At the end of the day, users don't care how beautiful your code is.
They care about one thing: whether the system still works when they need it most.
Good developers write code that works.
Experienced developers write code that keeps working when everything starts going wrong.
The difference rarely lies in the programming language, framework, or tool. It lies in how they see the system as a whole.